
Index
Counting closed tickets can reward quick responses that do not resolve the demand. A fulfillment dashboard needs to combine volume, wait, and completion quality signals.
How to evaluate this decision
Define opening, first response, resolution and reopening according to the system used. Separate running time and opening hours when the question requires it. Compare similar categories and complexities. Reopening may indicate a failed solution, but also a new demand registered in the same ticket; the interpretation needs to be validated with the operation.
Criteria for comparing proposals
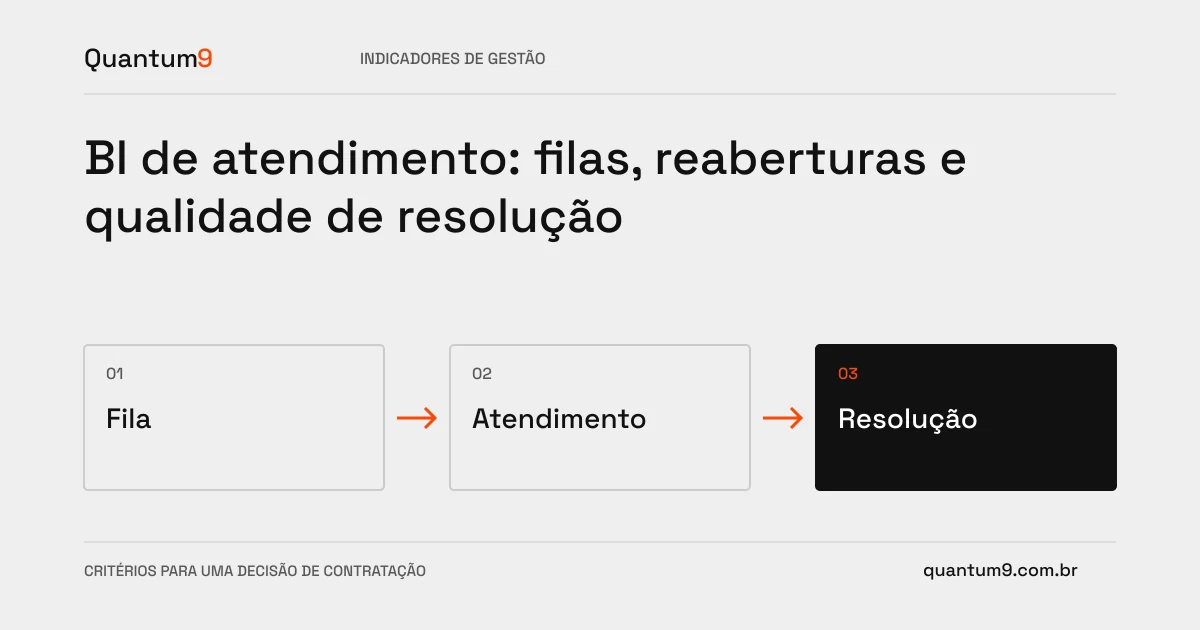
- Queue: show age, priority and person responsible for services still open.
- Flow: measuring transfers and waits without hiding time in intermediate states.
- Resolution: monitor recurrence and reasons for reopening with referenceable examples.
A scenario to discuss with the supplier
Hypothetical example: A team closes tickets when asking for more information. This reduces the apparent time to resolution, but does not complete the customer's task. The indicator rule should correct this reading.
What to validate upon delivery
Rebuild the history of selected tickets and compare times. Check queue changes, holidays and reopenings before comparing teams.
Prepare the conversation about the project
Send service statuses, calendars and management questions to Quantum9. The scope must produce shared definitions and access to records that explain the indicators.
Data and BI · Map the company's priority