
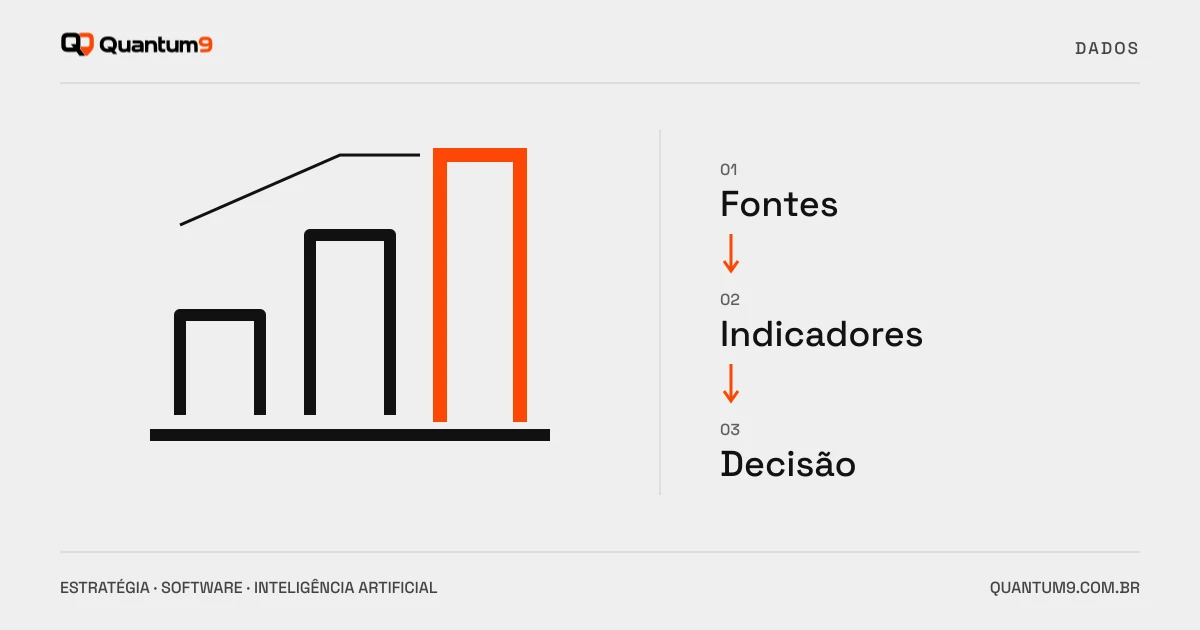
Define indicators, sources and people responsible before hiring a management dashboard. See criteria to validate numbers and usefulness.
Index
A dashboard for the board must respond to recurring decisions. If the meeting continues to spend time discussing which number is correct, the problem is not the choice of chart. Contracting must include definition of indicators, reconciliation of sources and responsibility for each data.
Start with the decision, not the tool
List questions such as: where did the margin fall, which orders are delayed and which stage of the funnel lost conversion? For each question, define who acts and what action the indicator allows. A dashboard with many metrics without a responsible person tends to become a static presentation.
Create an indicator dictionary
Revenue can mean the amount contracted, invoiced or received. Document formula, reference date, filters, exclusions and periodicity. Combine the handling of cancellations, returns and retroactive releases. The definition needs to be understandable for the business area.
- Official source responsible for each indicator.
- Update frequency and last charge time.
- Permissions by area, unit or profile.
- Detail that allows you to investigate a discrepancy.
How to validate the first panel
Choose a closed period and compare the result with approved reports. Investigate differences rather than rounding them to look correct. Then simulate a decision with the manager: does the panel show where to act or does it require exporting everything and redoing the analysis?
Include invisible work in the budget
Extracting, cleaning, shaping and maintaining loads can require more effort than visualization. Compare proposals that explain these steps. Licenses and user access also vary depending on the tool and must be verified at the time of hiring.
Prepare the data for the conversation
Bring current reports, questions from management, and an example of the disagreement. Quantum9 can define a first set of verifiable indicators. If the sources are still fragmented, the data pipelines explains the step before the panel.